
Standard Deviation in Trading: Understanding Trade Outcomes and Risk (2026)
 August 2, 2026
9 min read
August 2, 2026
9 min read
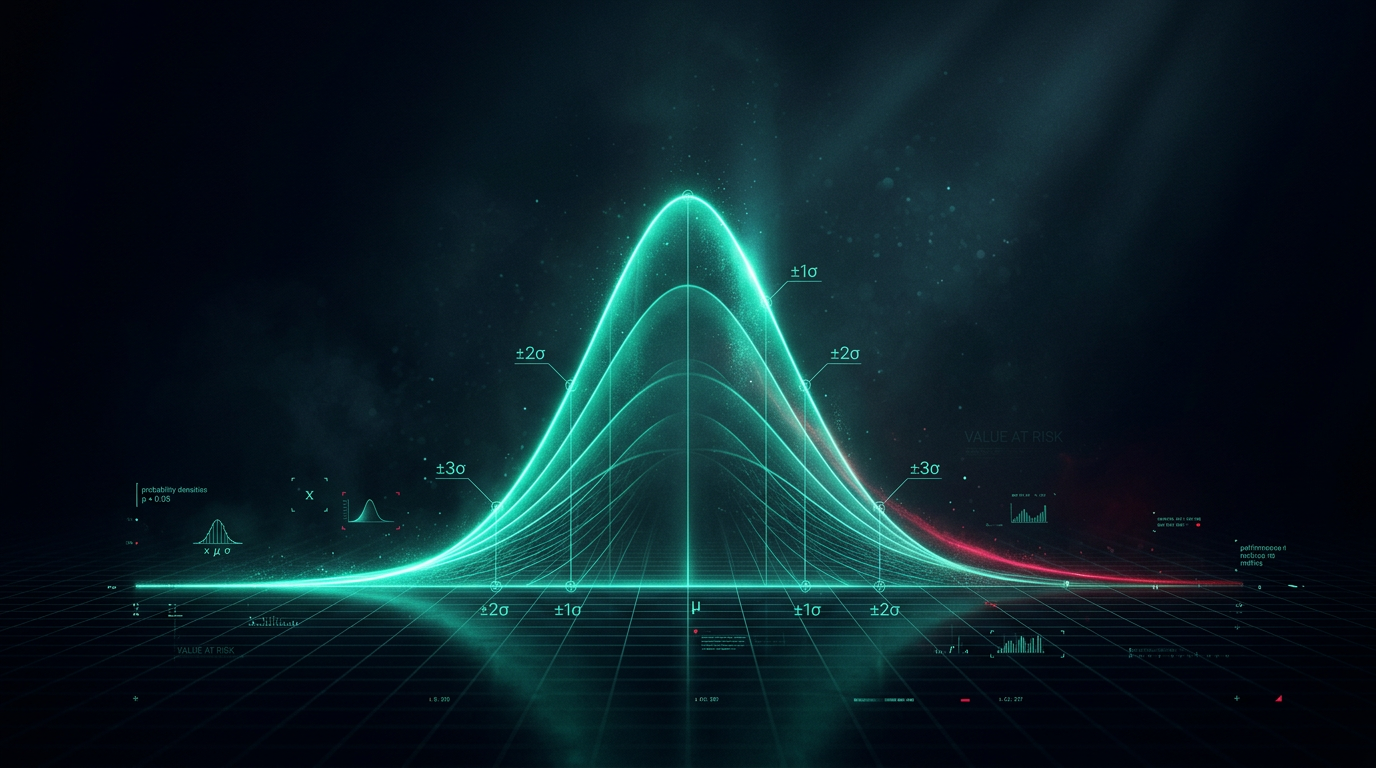
Standard deviation in trading measures how far your results tend to spread out from their average. It is the number that turns a vague sense of how choppy something is into a figure you can use. Applied to a market, it describes volatility. Applied to your own trade outcomes, it describes how consistent, or how erratic, your results really are. Either way, it is a measure of spread, and spread is risk.
Most traders judge their performance by the average alone. They know their average win, their average loss, maybe their win rate. But two traders can have the same averages and completely different experiences, because one has tight, repeatable results and the other swings wildly. Standard deviation is what separates them, and ignoring it is how people underestimate their own risk.
In this guide we will define standard deviation in plain terms, connect it to the normal distribution and market volatility, show how it shapes the spread of your trade outcomes, and explain how to use it inside a simulated funded account without drowning in math.
Key Takeaways
- Standard deviation measures spread. It quantifies how far outcomes typically fall from the average, so a bigger number means more variability and more risk.
- It is the language of volatility. Market volatility is usually just the standard deviation of returns over a period.
- Averages hide risk. Two strategies with the same expectancy can feel completely different if their standard deviations differ.
- Tails are where accounts break. Rare, large moves live in the tails of the distribution, and real markets have fatter tails than the textbook curve.
- Size to the spread, not the average. Position sizing should account for how wide your outcomes swing, not just what they average.
What is standard deviation in trading?
Standard deviation is a statistic that measures how far a set of numbers typically sits from their average. A low standard deviation means the numbers cluster tightly around the mean. A high standard deviation means they are scattered widely. In trading, those numbers can be daily returns, the size of price moves, or the profit and loss of your individual trades.
The idea is intuitive even without the formula. If your last twenty trades all landed near your average result, your standard deviation is small and your trading is consistent. If some were huge winners and others were painful losers, your standard deviation is large, and your equity curve is bumpy. The US Securities and Exchange Commission's investor education site explains volatility in this same spirit at investor.gov.
Standard deviation as volatility
When people say a market is volatile, they usually mean its returns have a high standard deviation. A stock that moves a fraction of a percent per day has low return volatility. One that swings several percent has high return volatility. Same statistic, applied to price returns instead of your trade results. This is why volatility and standard deviation are often used interchangeably in market talk.
The normal distribution and its bands
Standard deviation is easiest to picture through the normal distribution, the familiar bell curve. In an idealized normal distribution, about 68 percent of outcomes fall within one standard deviation of the average, about 95 percent within two, and about 99.7 percent within three. The infographic below shows those bands.
Where outcomes fall around the average
 tradefundrr.com · Illustrative example, not a forecast
Standard deviation and the spread of outcomes
The spread of your trade outcomes is what standard deviation captures, and that spread is the real texture of your trading. A strategy is not just its average result. It is the whole distribution of results, the winners and losers and how far each strays from the middle. Standard deviation is the single number that summarizes how wide that distribution is.
This matters because risk lives in the spread. A wide distribution means larger swings in both directions, and larger swings are what threaten a daily loss limit or a drawdown rule. A trader with a tight distribution can survive a rough patch that would knock out a trader with a wide one, even if both have the same average trade.
Two traders, same average, different risk
Imagine two traders who both average a small gain per trade. The first has a standard deviation of half their average. Their results are tightly clustered, their equity curve is smooth, and a bad day is a small dent. The second has a standard deviation several times their average. Their winners are bigger, their losers are brutal, and a single cluster of bad trades can breach a loss limit. Same average, very different accounts.
This is why professional risk managers care about the standard deviation of returns, not just the returns. It is also the basis of risk-adjusted metrics. Our guide on risk-adjusted returns shows how the Sharpe ratio divides return by standard deviation to reward consistency, not just raw profit.
Why averages alone are misleading
Averages alone are misleading because they collapse the whole story into one number and throw away the variability. A person can drown in a river with an average depth of a few inches. In trading, you can go broke with a positive average trade if the variability is high enough and a run of losses lands at the wrong time. The average tells you the center. The standard deviation tells you the danger.
The tails are what break accounts
The tails of the distribution are the rare, extreme outcomes, and they do outsized damage. In a normal distribution, moves beyond three standard deviations are supposed to be almost impossible. In real markets they happen far more often, because returns have fatter tails than the bell curve assumes. The Commodity Futures Trading Commission warns repeatedly that leveraged losses can exceed deposits, and that warning is really about the tails. Its education resources are at cftc.gov.
The practical lesson is humility. Do not size your account as if the worst case is one standard deviation. Size it so that a rare, multi-standard-deviation stretch does not end you. Our guide on risk of ruin works through how the odds of a fatal drawdown depend on that spread.
Consistency is what a funded evaluation is really testing. Trade a structured, simulated program with defined risk rules and see the standards for yourself.
See the programs →Using standard deviation to size and manage risk
You use standard deviation by sizing your positions to the spread of outcomes, not to the average, so that a normal bad stretch stays inside your rules. This does not require you to compute anything by hand. It requires you to respect the fact that your results vary, and to leave room for that variation.
| Trait | Low standard deviation | High standard deviation |
|---|---|---|
| Equity curve | Smooth and steady | Jagged with sharp swings |
| Worst realistic stretch | Shallow, easy to recover | Deep, can breach a drawdown rule |
| Emotional load | Manageable | Heavy, tempts overtrading |
| Right position size | Can be a touch larger | Should be smaller to stay in bounds |
| Risk-adjusted return | Higher for the same average | Lower for the same average |
Practical ways to apply it
Track the spread of your own results, not just the average. Keep a simple log so you can see whether your outcomes are tightening or widening over time. Widening spread is an early warning that something in your process has slipped, often before your average turns negative.
- Log every trade result so you can see the full spread, not just wins and losses.
- Size positions so a normal losing stretch stays inside your daily loss limit.
- Assume the tails are fatter than the textbook, and leave margin for them.
- Prefer a tighter, more consistent distribution over a wild one with the same average.
- Watch for a widening spread as a signal your process needs a review.
Standard deviation in a simulated account
Inside a TradeFundrr funded account, you trade in a structured, simulated environment, and the same statistics apply. Your simulated results have an average and a spread, and the account's rules are built around keeping that spread inside sensible bounds. A daily loss limit and a drawdown rule are, in effect, limits on how far a bad tail is allowed to run before the account pauses.
That framing is useful. When you see a loss limit not as a punishment but as a boundary on the distribution, it becomes a tool for consistency rather than an obstacle. A payout is never withheld arbitrarily at an honest firm. The only thing that stops one is a rule the trader actually broke, and most rules exist to keep your outcomes from spreading into account-ending territory.
Standard deviation is not a formula to memorize. It is a habit of mind. Respect the spread, size for the tails, and prefer consistency, and you will manage risk the way the rules are designed to reward.
Frequently Asked Questions
What does standard deviation measure in trading?
Standard deviation measures how far outcomes typically fall from their average. Applied to market returns it describes volatility, and applied to your trade results it describes consistency. A larger standard deviation means wider swings and more risk, while a smaller one means tighter, more repeatable results.
Is high standard deviation good or bad for a trader?
Higher standard deviation means more variability, which usually means more risk. For the same average result, a lower standard deviation is generally preferable because the equity curve is smoother and less likely to breach a loss limit. It also produces a better risk-adjusted return.
How is standard deviation related to volatility?
They are essentially the same idea. Market volatility is typically calculated as the standard deviation of returns over a period, then often annualized. When a market is called volatile, it means its returns have a high standard deviation, so prices swing widely around their average.
Why do averages understate trading risk?
Because an average hides variability. Two strategies with an identical average trade can have very different risk if one has a much wider spread of outcomes. The average shows the center of your results, but the standard deviation shows how far a bad run can carry you from it.
How does standard deviation affect my daily loss limit in a funded account?
The wider your outcome spread, the more likely a normal losing stretch bumps into your daily loss limit. Sizing positions to your standard deviation, rather than to your average trade, keeps ordinary variability inside the account's rules. Always confirm the exact limits in your written account terms.
Do real markets follow the normal distribution?
Only roughly. Real returns cluster like a bell curve most of the time but have fatter tails, so extreme moves occur more often than the 99.7 percent rule implies. This is why prudent traders plan for larger shocks than the textbook curve predicts.
Do I need to calculate standard deviation by hand to use it?
No. Most trading journals and spreadsheets compute it automatically. The value is in the concept, sizing for the spread of outcomes rather than the average, and watching whether your spread is tightening or widening over time. You do not need the formula to apply the discipline.
Consistency is the real target
A structured, simulated funded account rewards steady, repeatable results over wild swings. See the rules that make consistency the point.
Get Funded →