
Indicator Overload: Why More Signals Lead to Worse Trading Decisions in 2026
 September 30, 2026
13 min read
September 30, 2026
13 min read
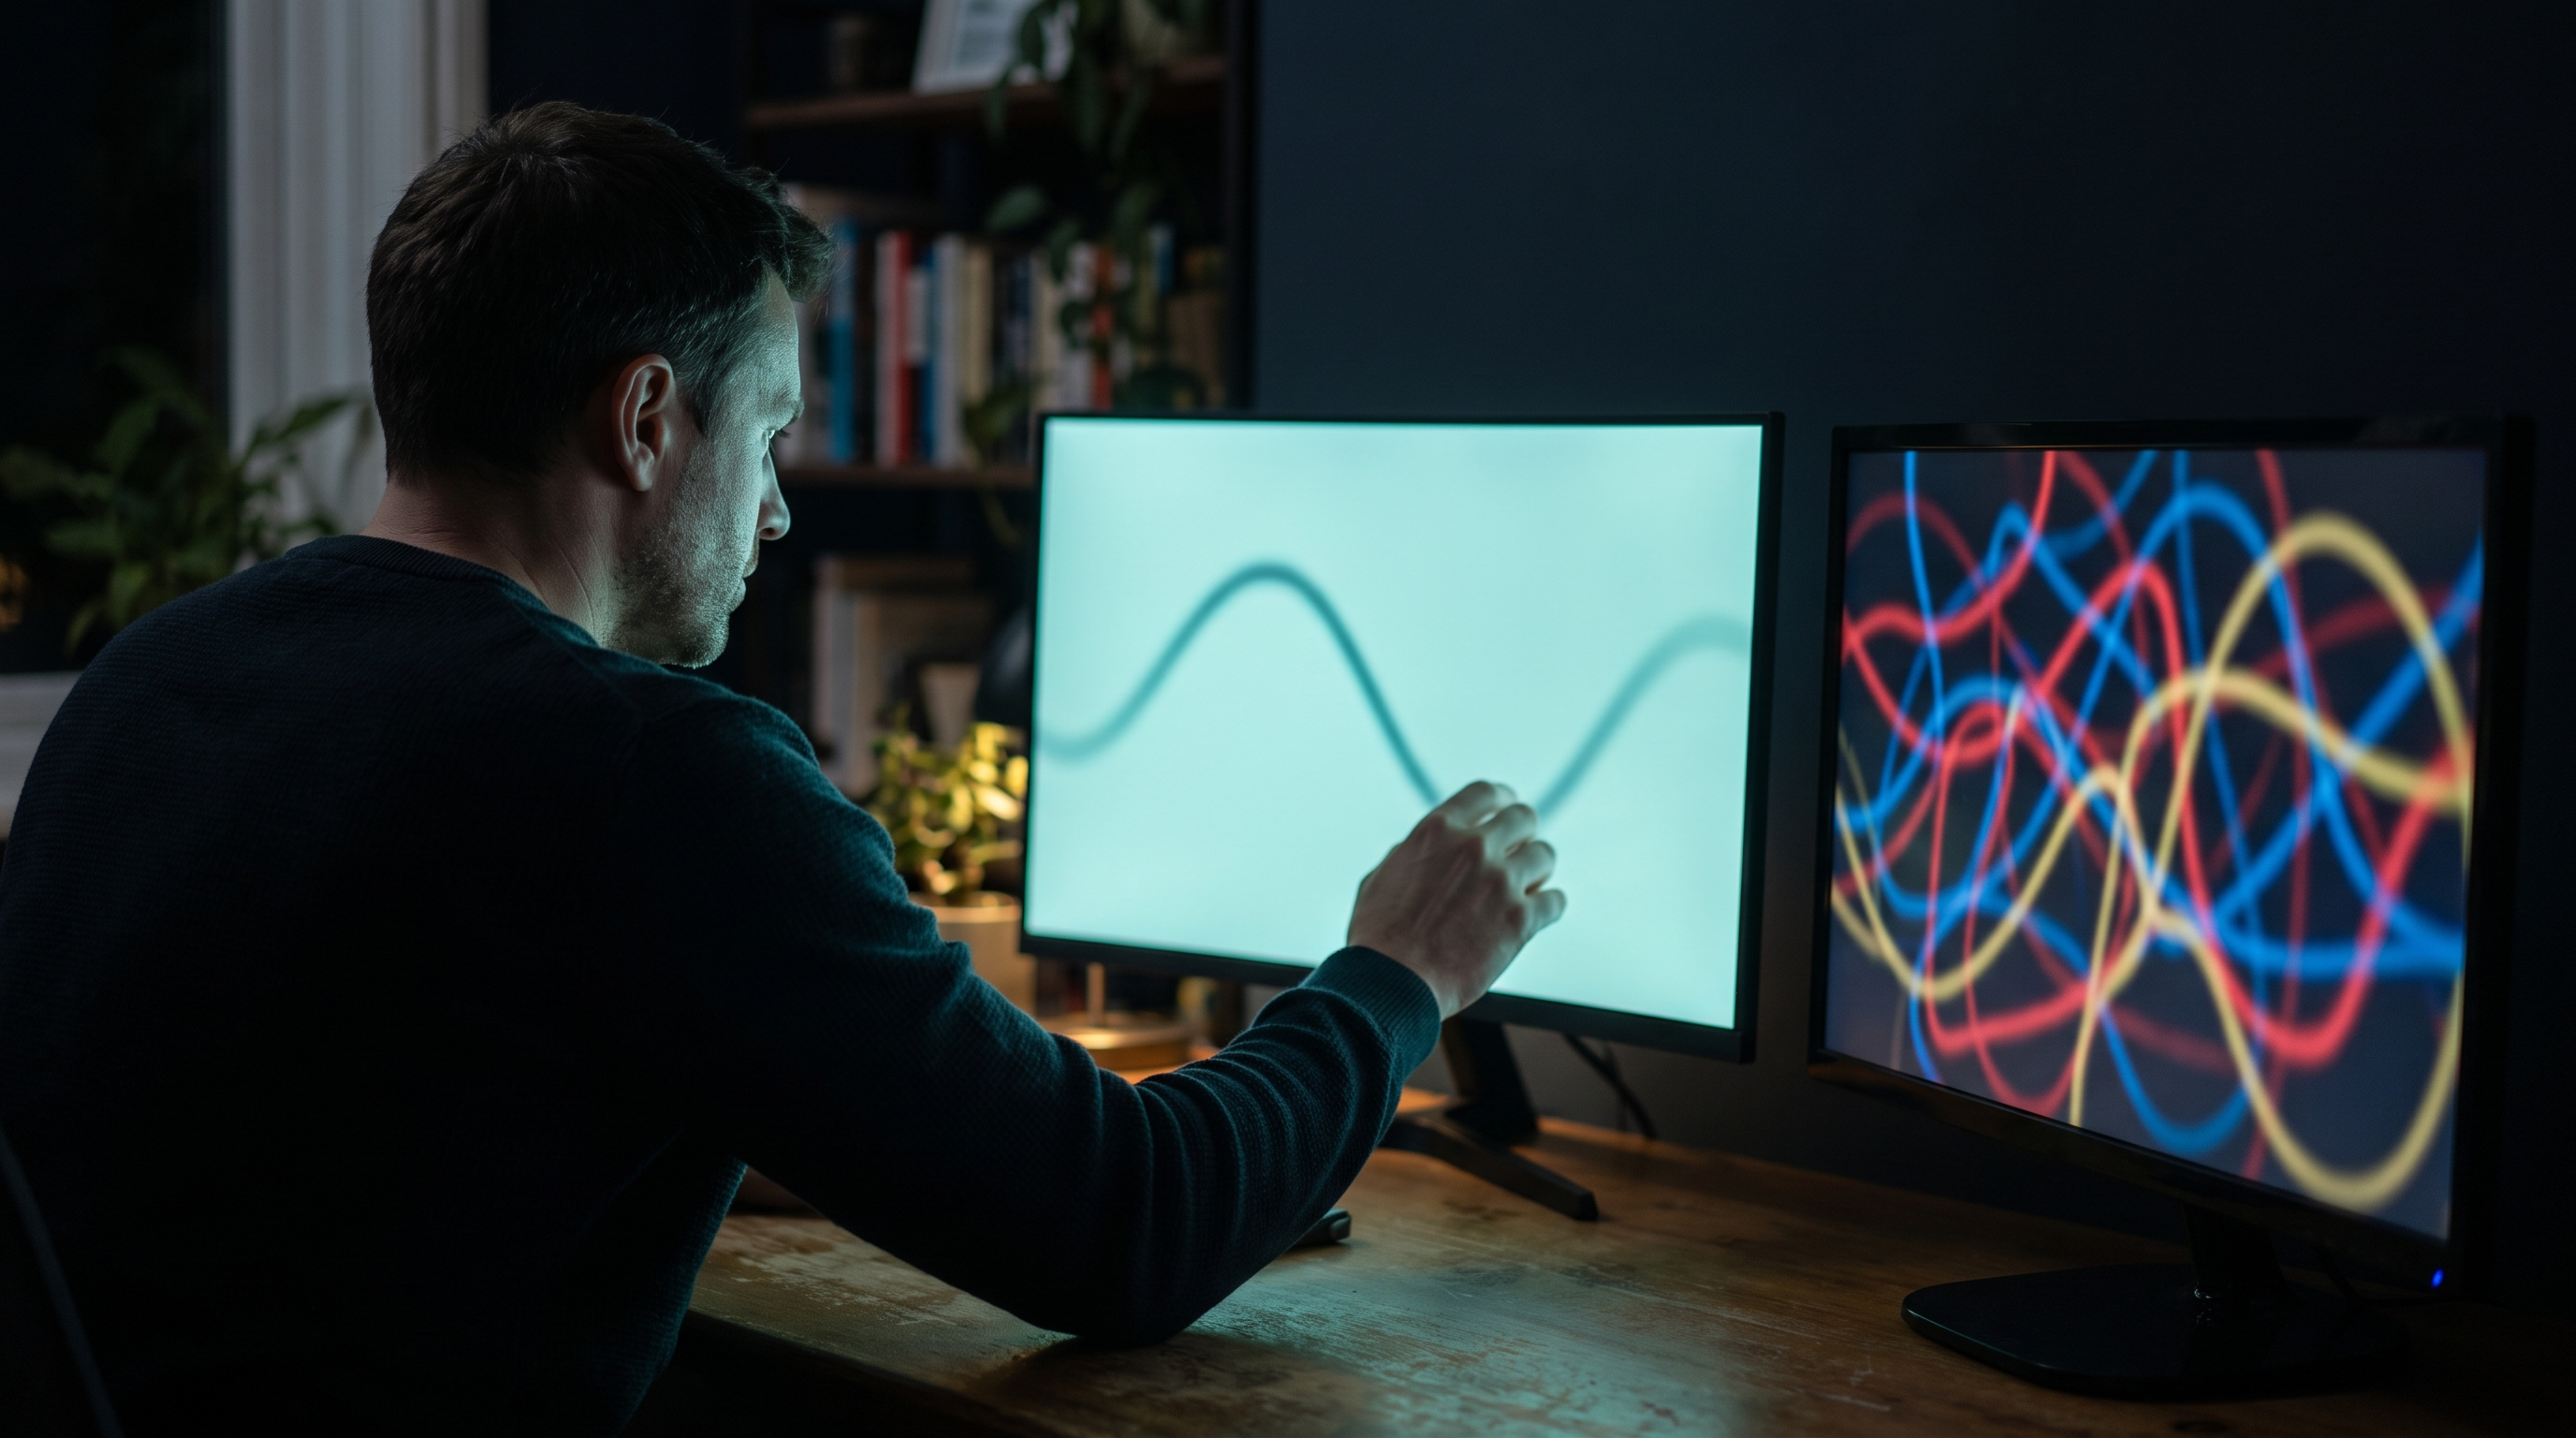
Indicator overload is what happens when a chart carries so many studies that they stop helping you decide and start arguing with each other. The RSI says overbought, the moving average says uptrend, the MACD is about to cross and the stochastic already did. Every tool has an opinion, and the trade you planned sits there waiting for a unanimous vote that never comes.
Most traders do not build an overloaded chart on purpose. They add one indicator after a loss, another after reading about it, a third because a screenshot looked convincing. Each addition feels like more information. In practice, many of those tools are measuring the same thing, and the extra layers mostly add delay, doubt and room to justify whatever you already wanted to do.
In this guide we'll explain what indicator overload is, why more indicators often make decisions worse, how to strip a chart back to the tools that earn their place, why overload is usually an emotional problem wearing a technical costume, and how a lean chart fits the rules of a simulated funded account.
Key Takeaways
- Count questions, not indicators. Most charts ask two or three questions, however many studies are on them.
- Remove duplicates first. Oscillators built from the same closing prices usually agree because they are the same data reshaped.
- Give every tool a job. If you cannot say what an indicator must show before you enter, it is decoration.
- Notice when you add tools after losses. A new indicator after a normal loss is usually reassurance, not analysis.
- Let the rules handle risk. No indicator replaces a stop, a size limit or a daily loss limit.
Table of Contents
- What is indicator overload?
- Why more indicators make decisions worse
- How to strip a chart back
- Why overload is usually an emotional problem
- Indicator overload in a funded account
What is indicator overload?
Indicator overload is using more technical indicators than your decision actually needs, to the point where they slow you down, contradict each other or give you permission to override your plan. It is not defined by a number of studies. A chart with three redundant oscillators is more overloaded than a chart with four tools that each answer a different question.
Most indicators are the same price, reshaped
Nearly every popular indicator is a formula applied to the same inputs: open, high, low, close and, sometimes, volume. The relative strength index compares recent up closes with recent down closes. The stochastic oscillator locates the close within a recent high-low range. Rate of change measures how far the close has moved over a set number of bars. The MACD is the difference between two moving averages of the close.
Four names, four colors, one underlying question: how fast and how far has price moved lately? When those tools agree, it feels like four confirmations. It is closer to one observation displayed four times.
The symptoms
Overload has a recognizable feel. You wait for "one more" signal before entering and then chase the move. You find a reason to take a trade from one tool and a reason to skip it from another, and you pick whichever matches your mood. You cannot remember which indicator you were supposed to be watching when price reached your level. And after a loss, you can always find the tool that "warned you," which is the most convincing and least useful feeling in trading.
If two or more of those sound familiar, the problem is probably not a missing indicator. It is too many present ones.
Why more indicators make decisions worse
More indicators make decisions worse because redundant tools create false confidence, conflicting tools create delay and selective reading, and every extra tool with adjustable settings adds another way to fit your method to the past. The chart gets more complicated without getting more accurate.
Redundancy feels like confirmation
Confirmation only means something when the second source is independent of the first. Two oscillators built from the same closing prices are not independent. When both flash overbought at once, you have learned roughly what one of them already told you, but it feels like a stronger case, and traders tend to size and hold with more conviction when a case feels stronger.
Genuinely different evidence looks different. A trend reading, a price level and a measure of participation such as volume come from different angles. They can disagree for real reasons, and that disagreement is informative.
| Indicator family | Question it answers | Common examples | Usually redundant with |
|---|---|---|---|
| Trend | Which way is price leaning? | Moving averages, moving-average slope | Other moving averages of similar length |
| Momentum | How fast has price moved lately? | RSI, stochastic, rate of change, MACD | Each other; all are built from recent closes |
| Volatility | How far does price normally travel? | Average true range, band width | Other range-based measures |
| Participation | How much activity is behind the move? | Volume, volume-weighted average price | Other volume transforms |
| Location | Where is price relative to what matters? | Prior high and low, session open, marked levels | Rarely redundant; often the most useful layer |
One tool per family is usually enough. Two from the same family tend to repeat each other.
Conflict creates delay and selective reading
With enough tools on a chart, some of them will always disagree. That gives you two bad options. You can wait for agreement, which usually means entering late, after the move has used part of the distance to your target. Or you can decide which tool to believe in the moment, which quietly hands the decision to whatever you were hoping for. Either way, the method you wrote down is no longer the method you are trading.
Lag stacks on lag
Most indicators are calculated from bars that have already closed, so each one reports what price did, a little after it did it. That is not a flaw, it is how they work. But a rule that waits for several lagging tools to agree waits for the slowest one, and the slowest one decides when you enter. By the time a moving-average cross, an oscillator turn and a MACD signal all line up, the part of the move they were describing is often behind you, and your stop has to sit further away to make sense.
More settings, more ways to fit the past
Every indicator comes with parameters: lengths, thresholds, smoothing. Each one is a dial you can turn until the chart explains yesterday perfectly. The more dials you have, the easier it is to build a method that fits past price action and fails on new data. Overfitting is sometimes called the bias you build on purpose, because every adjustment feels like an improvement. A crowded chart is overfitting done by eye.
Indicator overload
Six indicators, two questions
A crowded chart can look like six opinions. Sort the tools by the question they answer and see how many are left.
What a decision actually needs
Add a tool only when it answers a question nothing else on the chart already answers.
 tradefundrr.com
Illustrative example. Indicator groupings are simplified for teaching.
tradefundrr.com
Illustrative example. Indicator groupings are simplified for teaching.
How to strip a chart back
To strip a chart back, list the questions your entry actually depends on, keep one tool per question, and remove anything that does not change a decision. Most day trading methods need an answer to three questions: what is the context, where is the level, and where is the idea wrong. Everything else is optional.
One tool per question
Start with a blank sheet rather than your current chart. Write down, in plain words, what must be true for you to enter. "Price is above the rising 20-period average, pulls back to yesterday's high and holds" is a complete statement. It needs a trend tool, a level and a price action rule. It does not need an oscillator, and adding one creates a fourth condition you never agreed to.
If you like a particular tool, keep it, but give it a specific job and make sure no other tool on the chart already does that job. We covered how one trend tool can carry a whole method in using moving averages intraday.
Write the job down
For every indicator that survives, write one sentence: what it must show for you to enter, and what it must show for you to stay out. If you cannot write that sentence, the tool is not part of your method. It is something you look at, and things you look at without a rule are exactly where hindsight and hope get in.
Run a removal test
Pick the indicator you are least sure about and trade without it for a block of sessions, recording in your journal every time you wished you had it. Then read the notes. If the missing tool would have changed very few decisions, it was not doing much. If it would have kept you out of trades that lost, you have evidence for its job and can write that job down. Either way, the decision is now based on your own record rather than a feeling about the chart.
Illustrative example: a trader running RSI, stochastic and MACD removes the stochastic for twenty sessions. Their notes show they missed it twice, and in both cases RSI was already giving the same reading. That is a tool that can go.
Keep location, lose decoration
If you strip a chart hard, the layer most worth keeping is usually location: the prior session's high and low, the open, and the levels you marked before the session began. Levels are not calculated from a lookback window and they do not repaint as new bars arrive. They tell you where a decision is due, which is the part of the job most indicators cannot do. Many traders who clear their charts find the levels were doing the real work all along, and the oscillators were commentary on top.
Why overload is usually an emotional problem
Indicator overload is usually an emotional problem because most tools get added in response to how a loss felt, not to a gap in the method. A new indicator promises that the next loss could have been avoided, and that promise is comforting. The discomfort it relieves is uncertainty, which no indicator removes.
Tools as reassurance
Losing trades are a normal part of any method with an edge. When a loss feels like a mistake, the natural response is to look for what you missed, and a chart with many tools always offers something. We covered this loop in accepting uncertainty in every trade: adding tools after a normal loss makes the method more complex without making it more accurate.
A useful habit is to ask one question before you add anything: am I adding this because of one trade, or because of a pattern across many trades in my journal? One trade is a feeling. A pattern is evidence.
Shopping for agreement
A crowded chart makes confirmation bias easy. If you already want to be long, you can find the tool that agrees, and if you want out, you can find the one that disagrees. The chart becomes a mirror. Fewer tools with written jobs leave far less room to shop. We covered the broader bias in confirmation bias and your trade thesis.
Be skeptical of signal products
Overload has a commercial side. Indicator packs, signal subscriptions and automated systems are often sold on the idea that the right combination of tools removes the guesswork. The CFTC's customer advisory on AI trading bots warns that fraudsters tout trade signal strategies and automated algorithms with unreasonably high or guaranteed returns, states plainly that AI technology cannot predict the future or sudden market changes, and tells customers to consider the impact of fees, spreads and subscription costs on returns. A product that promises certainty is selling the one thing a chart cannot give you.
- List every indicator on your chart and the question each one answers.
- Group them by family and mark any two that answer the same question.
- Keep one tool per question and remove the rest for a test period.
- Write one sentence per surviving tool: what it must show to enter and to stay out.
- Before adding a new tool, point to a pattern across many journaled trades, not one loss.
- Confirm your entry rule reads as a complete sentence without the word "maybe."
- Check that your stop and size are set by your risk plan, not by an indicator reading.
Indicator overload in a funded account
In a simulated funded account, indicator overload costs you through late entries, skipped trades and inconsistent decisions, while the account rules measure only the result. The daily loss limit and maximum drawdown do not care which tool you used. A lean chart makes it easier to trade the same way every day, which is what those rules reward.
The rules measure outcomes, not charts
TradeFundrr's programs are a simulated environment with written rules. On a Growth Plus 50K futures account, for example, the daily loss limit is $1,000 and the trailing maximum drawdown is $2,000, measured end of day. On the options programs, the $25,000 accounts carry a $1,000 daily loss limit. Those limits are indifferent to how confident your chart made you feel. They count what happened to the balance.
That matters because intraday losses arrive quickly. Investor.gov's definition of day trading describes it as extremely risky, with the potential for substantial losses in a very short period of time. A few minutes of hesitation followed by a late, oversized entry is exactly how that happens.
That is useful. It means the risk job is already done by the rules and by your stop and size. Your indicators only need to do the analysis job. Traders who expect an indicator stack to protect them from losses are asking a chart to do what a loss limit already does, and asking it to do it less reliably.
Consistency favors simple methods
Programs with consistency requirements reward a steady profile rather than one outsized day. A method with many conditions tends to trade unevenly: several quiet days waiting for alignment, then a burst of trades when everything lines up. A method with a few clear conditions tends to produce a more regular rhythm, and it is far easier to review honestly at the end of each week.
Manual trading means the decision is yours
TradeFundrr's futures programs are manual trading only. An indicator can inform your decision, but it cannot place the order for you, so every trade still passes through your judgment in the moment. The fewer competing voices on the chart at that moment, the easier it is to act on the plan you wrote while calm. That is a live-ready skill, and a simulated account is a low-cost place to build it.
None of this affects a payout decision directly. Your chart setup is not a rule. At TradeFundrr the only thing that stops a payout is a rule the trader broke.
Frequently Asked Questions
What is indicator overload in trading?
Indicator overload is using more technical indicators than your decision needs, so they slow you down, contradict each other or let you override your plan. It is about redundancy and unclear jobs, not a specific number of tools.
How many indicators should a day trader use?
Enough to answer each question your entry depends on, usually one tool per question. Many workable methods use two or three: something for context, a way to mark levels and a clear invalidation point.
Why do RSI and stochastic often agree?
Both are built from recent price data and both measure recent momentum within a lookback window. When they agree, you have mostly seen the same information twice rather than two independent confirmations.
Are more indicators more accurate?
No. Adding correlated indicators does not add independent evidence, and every extra setting is another way to fit a method to past data. Accuracy comes from a clear rule tested on your own trades, not from a busier chart.
Does TradeFundrr restrict which indicators I can use?
The published rules focus on risk, such as the daily loss limit, maximum drawdown and position limits, rather than on chart setup. Tools available depend on your platform, and futures programs are manual trading only, so confirm details in your own account terms.
Can indicator overload cause me to fail an evaluation?
Indirectly, yes. Overload leads to late entries, skipped trades and inconsistent decisions, and the account rules measure the results. A loss limit breach counts the same whatever the chart was showing.
Should I use indicators to set my stop in a funded account?
An indicator can help locate where an idea is wrong, but the dollar risk should come from your plan and your remaining daily loss allowance. Size first from the rules, then place the stop at a real invalidation point.
How do I know which indicator to remove first?
Start with any tool that answers the same question as another one on your chart, usually a second momentum oscillator. Trade without it for a test period, journal when you missed it, and let your own record decide.
A chart is a tool for making a decision, not a place to collect opinions. The traders who look calm at their screens are rarely the ones with the most information. They are the ones who decided in advance which information counts.
Clear the chart, give each remaining tool a job and let the rules carry the risk. Then trade the plan you can read at a glance, because under pressure that is the only plan you will actually follow.
Practice a lean method against fixed rules
TradeFundrr's simulated programs publish the daily loss limit and maximum drawdown up front, so your chart can do the analysis while the rules carry the risk.
Get Funded →